Verkko
Network scanner for a homelab: it continuously discovers the devices on each network, compares them with my inventory, editable from the interface, and flags anomalies. It runs on the NAS, behind a password.
- Year
- 2026
- Context
- Personal tool for my homelab
- Tech stack
- Python
- OOP
- Networking
- SQLite
- Prometheus
- Sphinx

01 · Context
The challenge
A practical need: in a growing homelab (a NAS, a Proxmox hypervisor, about ten VMs, connected devices), I kept forgetting which static IP I had given to which device, and the router's "connected devices" page knows neither static IPs nor VMs. Version 1 answered three questions: what is online, does it match my inventory, and which IP is still free. Every two minutes it discovers the devices of each network (with ARP on a local segment, with ICMP and a TCP probe beyond a router), enriches them, then flags anomalies. Daily use showed its limits, and version 2 removed them: adding an unknown device no longer means editing a file on the NAS and restarting, a laptop on DHCP is declared by its MAC, a new Proxmox VM joins the inventory on its own, and Verkko is now part of the homelab's monitoring.
02 · Architecture
How it's built
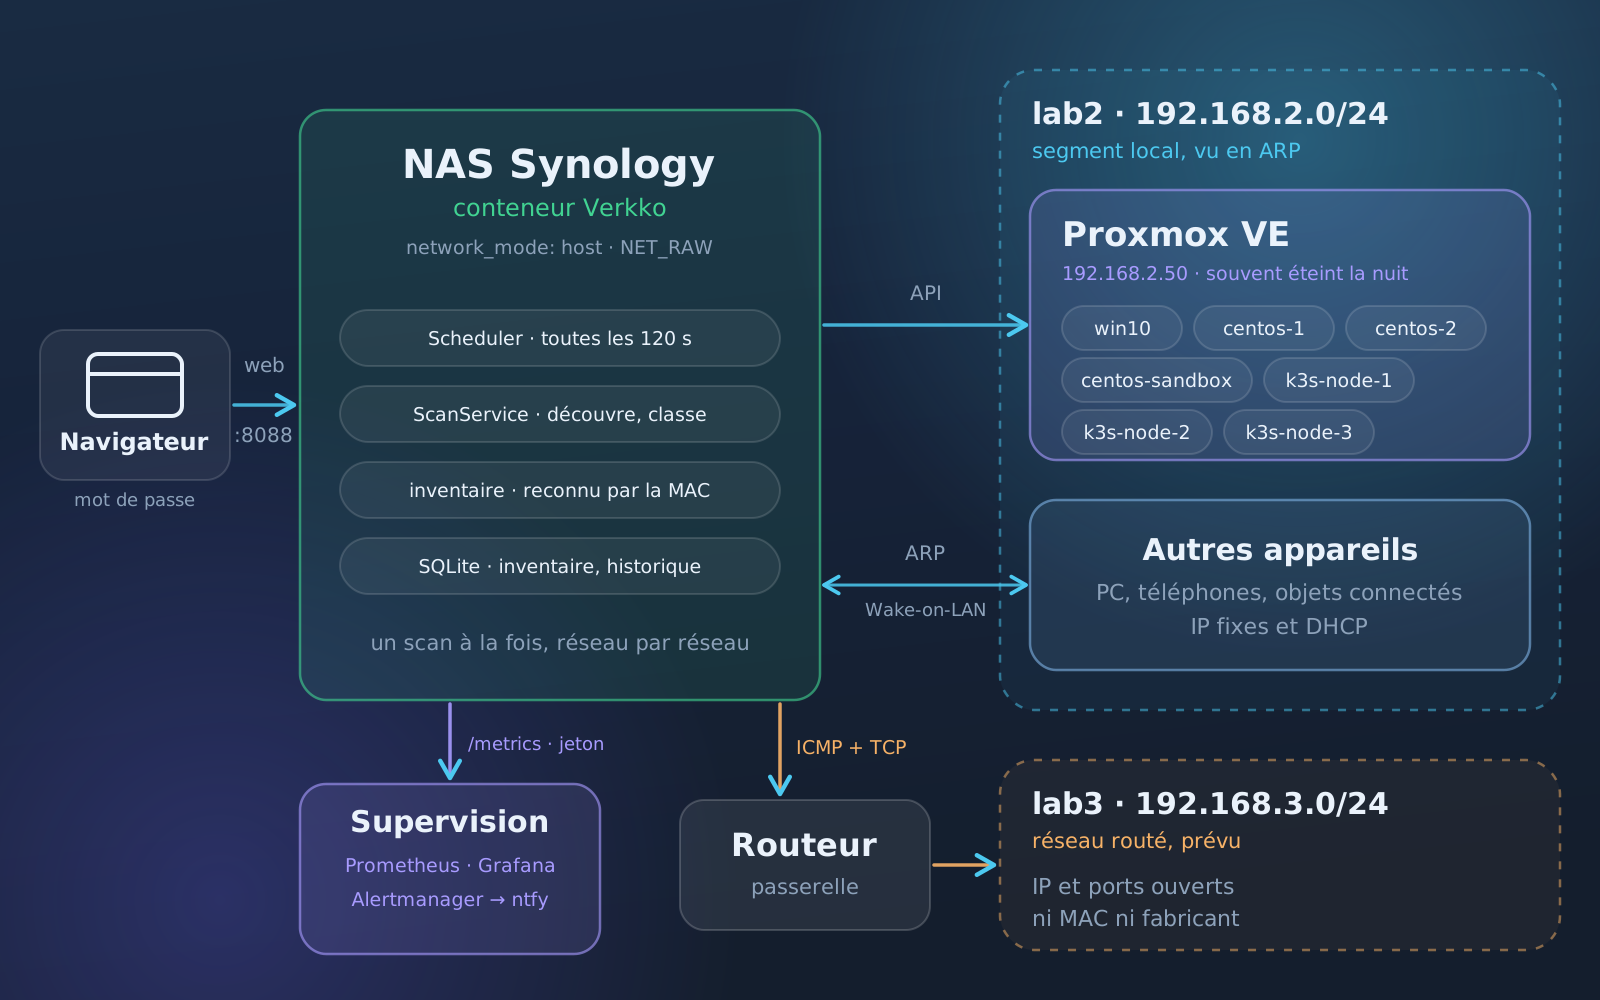
Key points
- Layered object-oriented architecture: each layer only depends on the ones below it
- Discovery method chosen automatically for each network: ARP, or ICMP and a TCP probe
- Inventory in a database, editable from the interface; devices recognised by their MAC, DHCP ones included
- Rule-based device type detection with a confidence level, and Proxmox VMs added automatically
- Token-protected Prometheus metrics, a Grafana dashboard and alerts; per-device availability that leaves out the hours when the NAS is off
- Single argon2-hashed password, Wake-on-LAN to wake machines up, Sphinx documentation and 17 decision records
03 · In pictures
Gallery
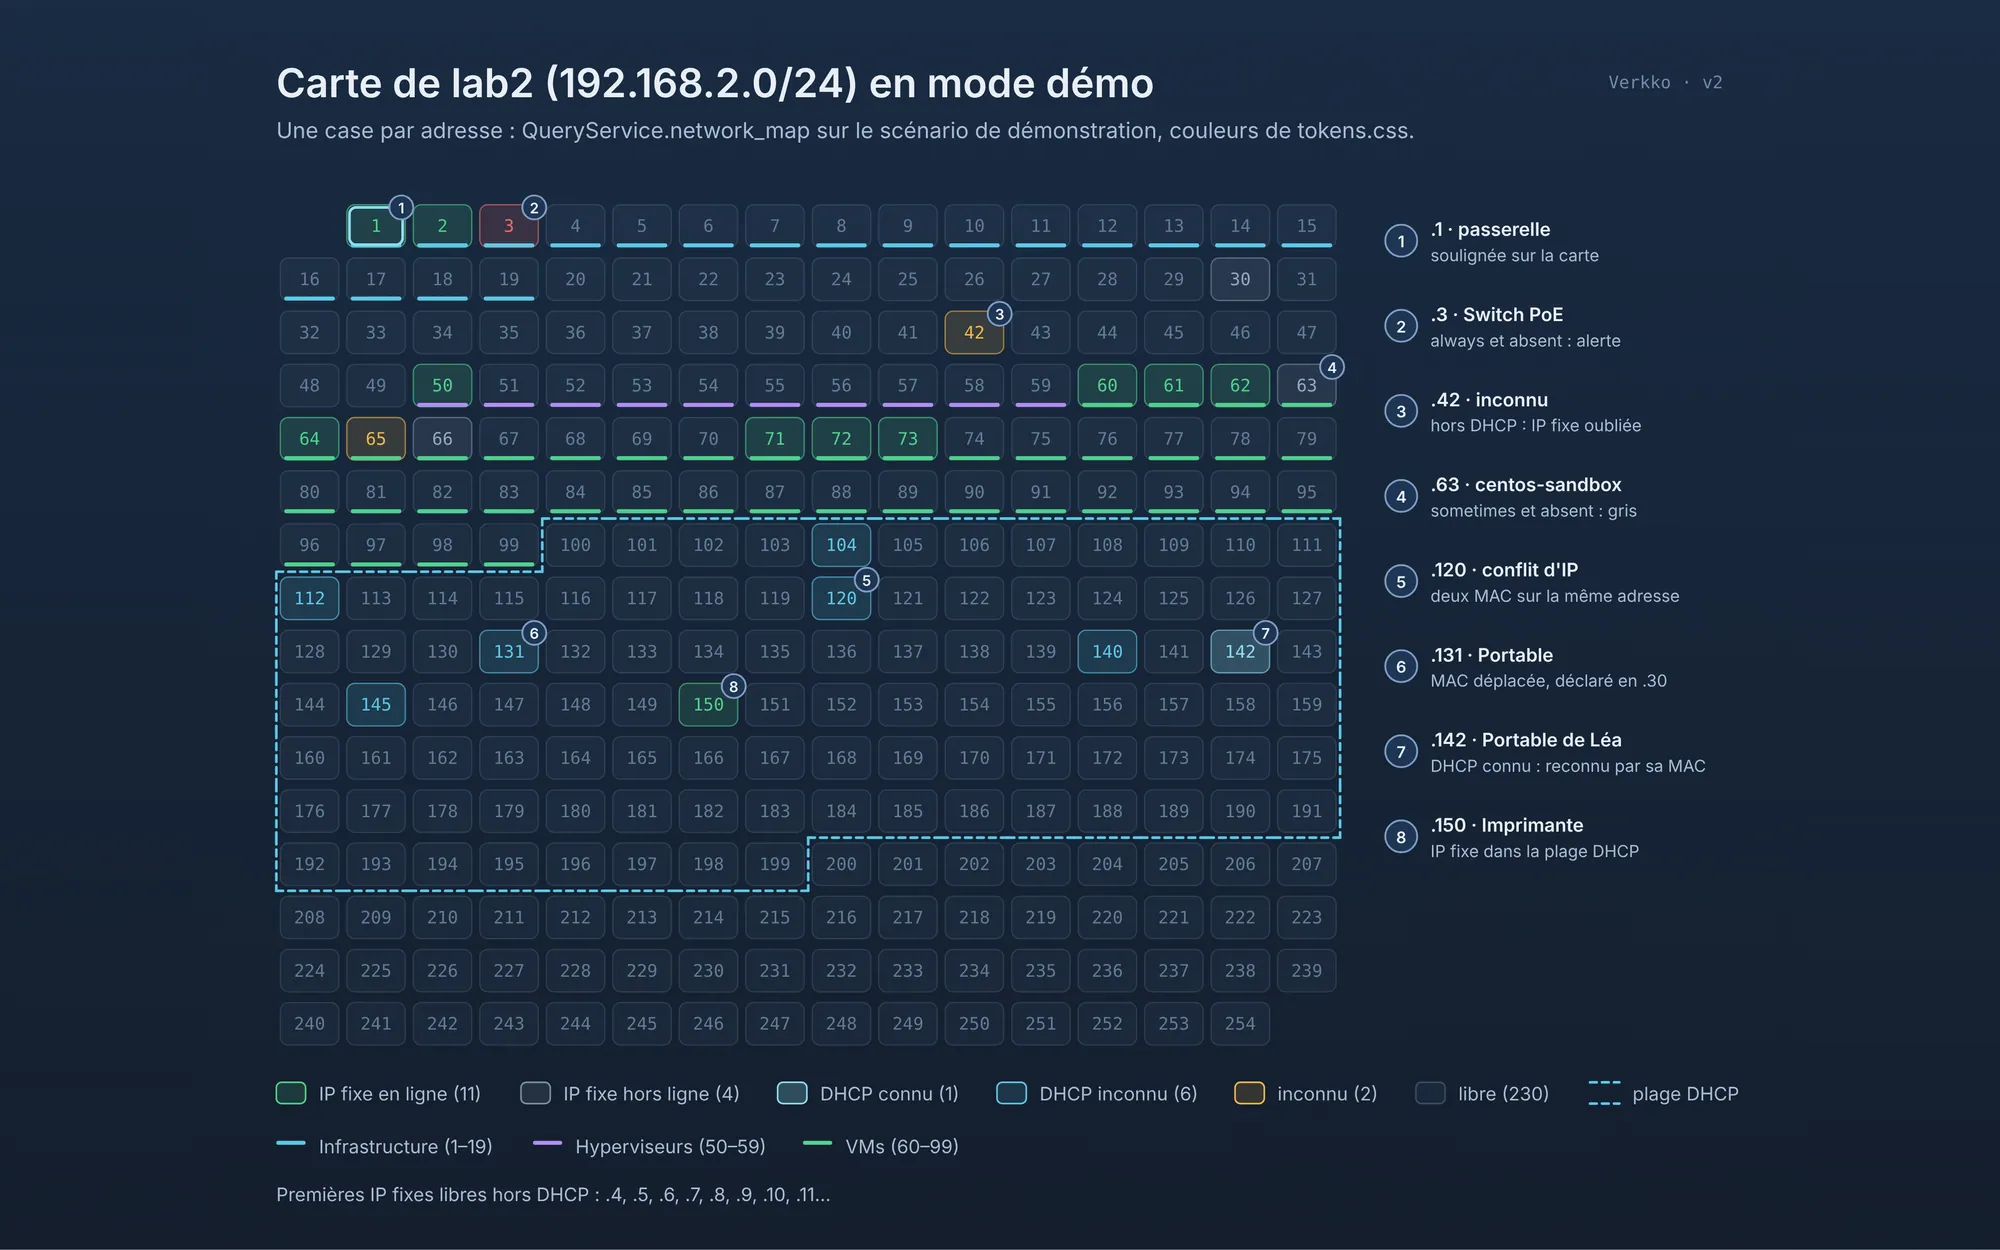
The map of a /24 in demo mode: one square per address, the zones of the addressing plan, the DHCP range and the anomalies spotted 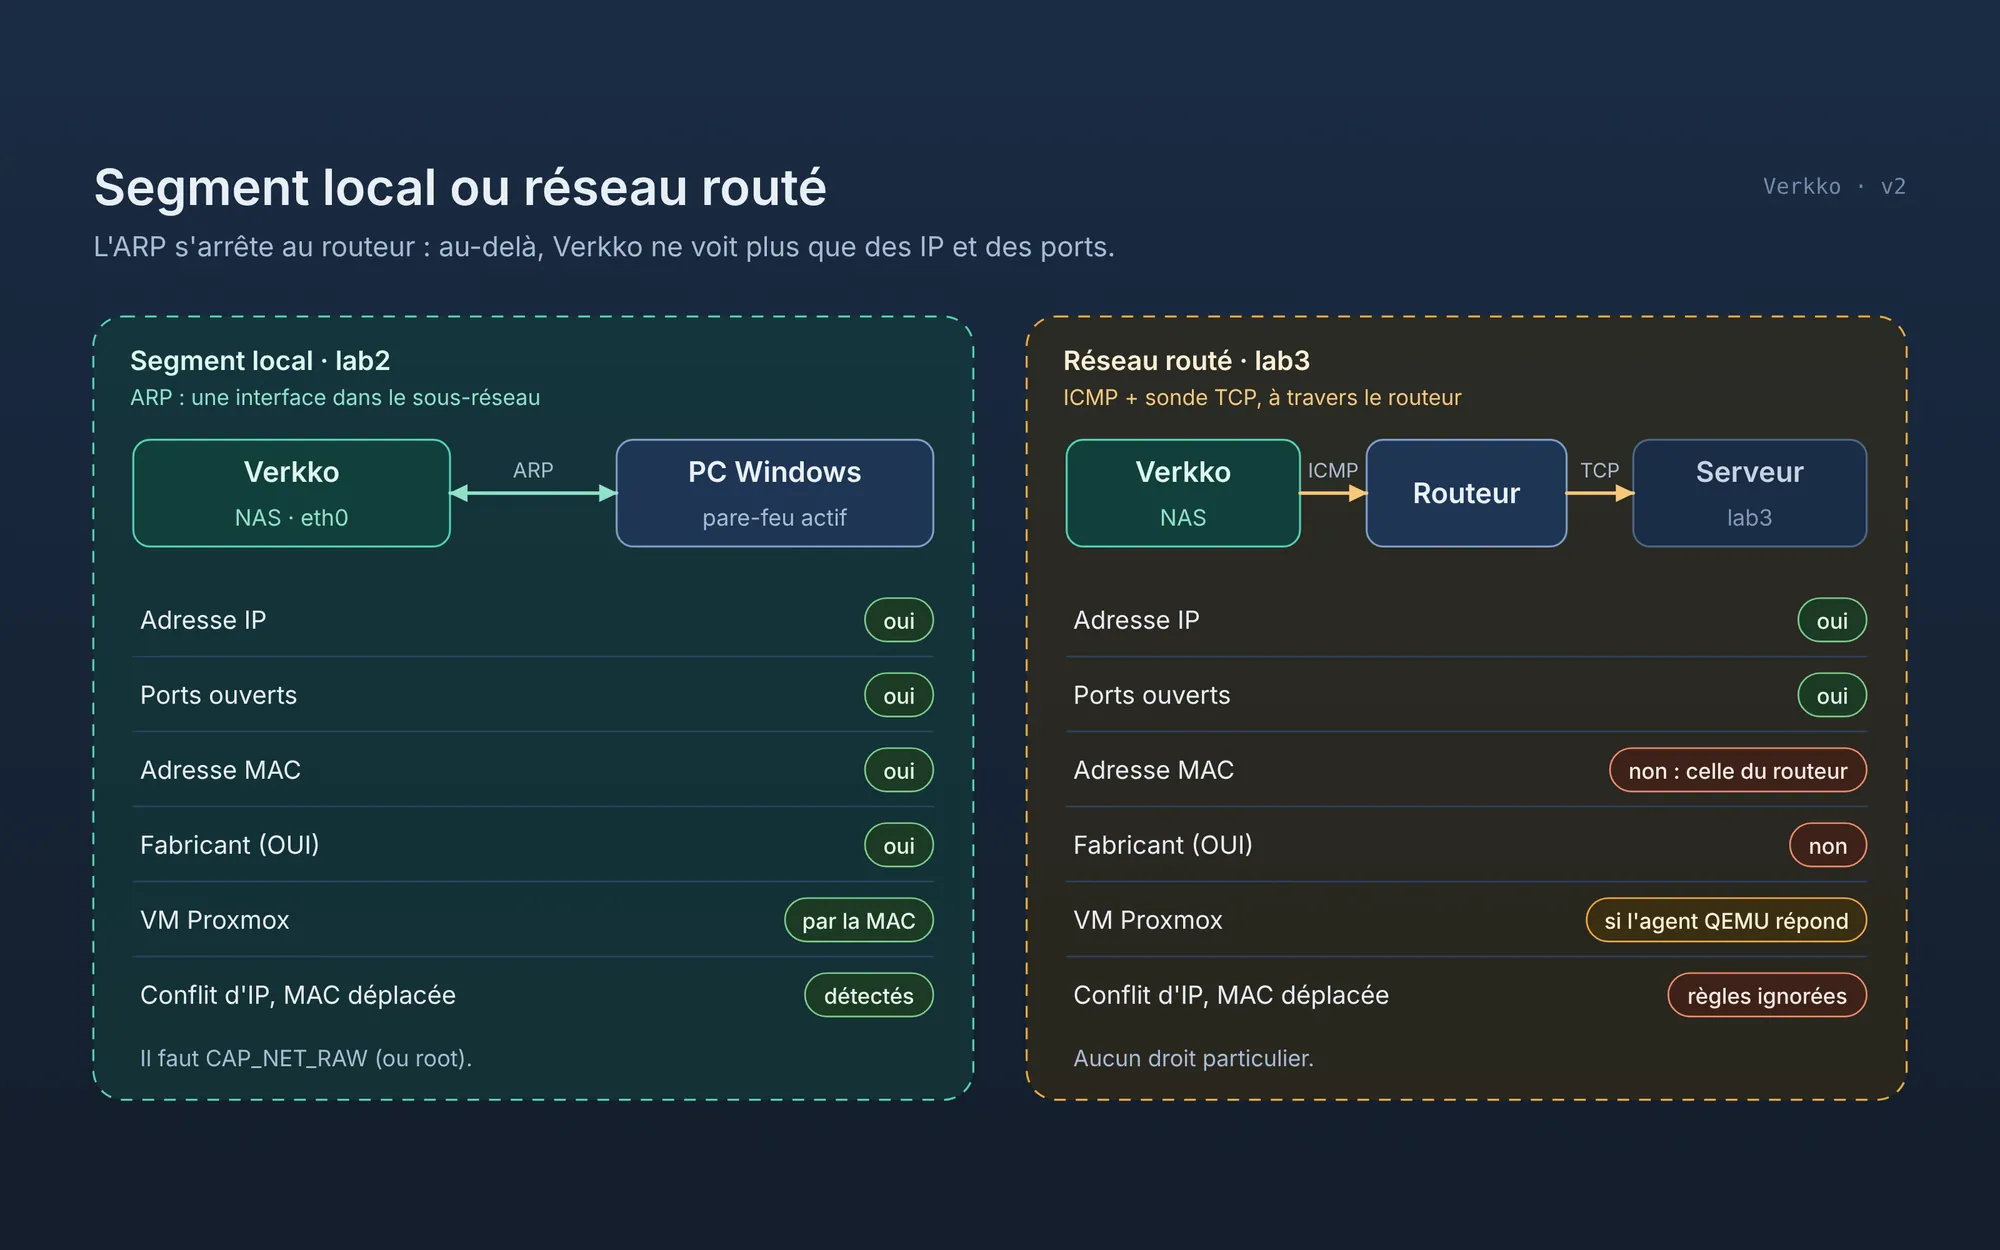
What Verkko sees on a local segment and on a routed network 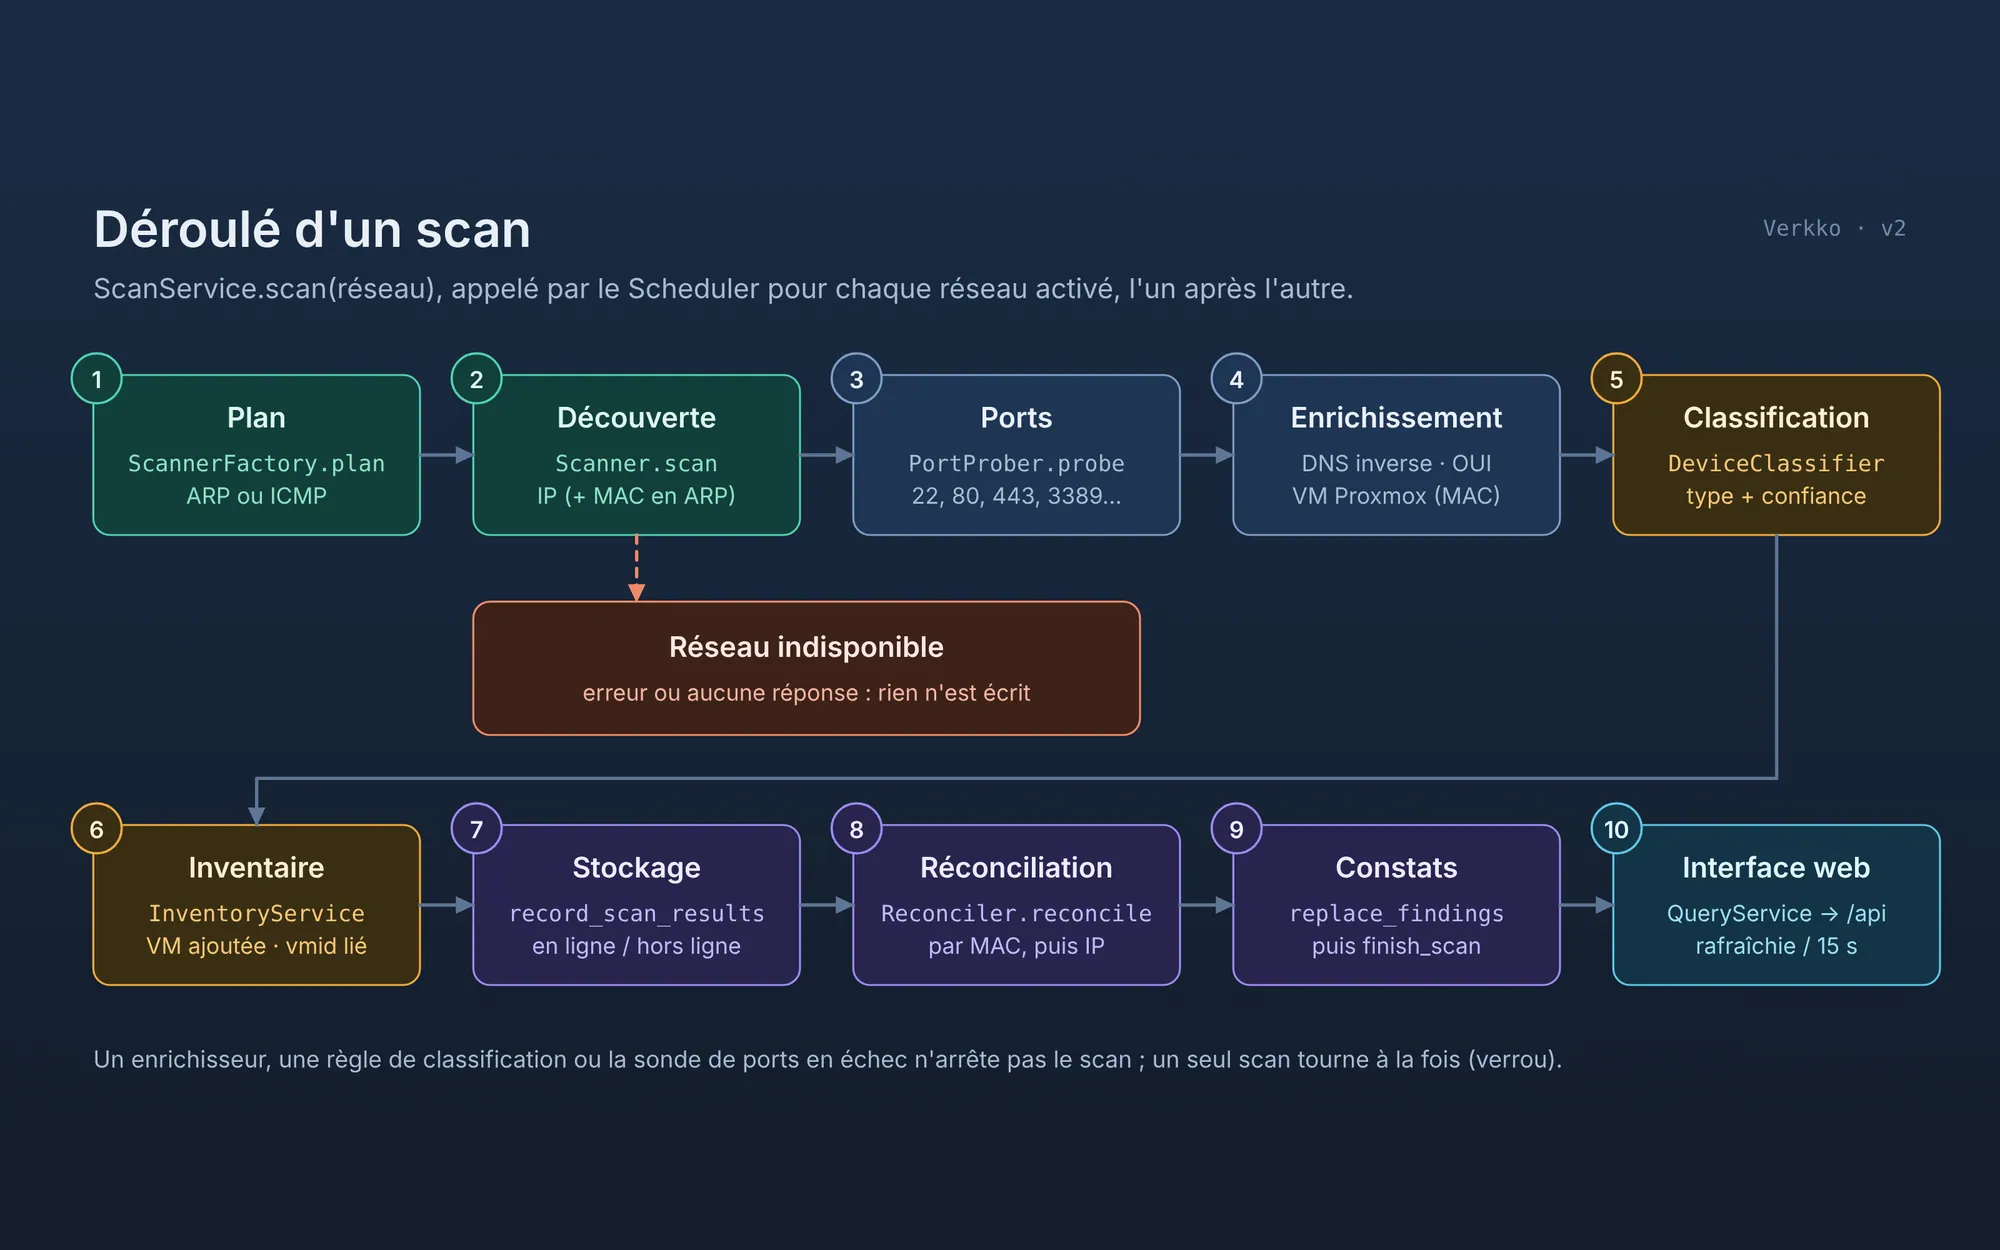
How a scan unfolds, from discovery to the web interface 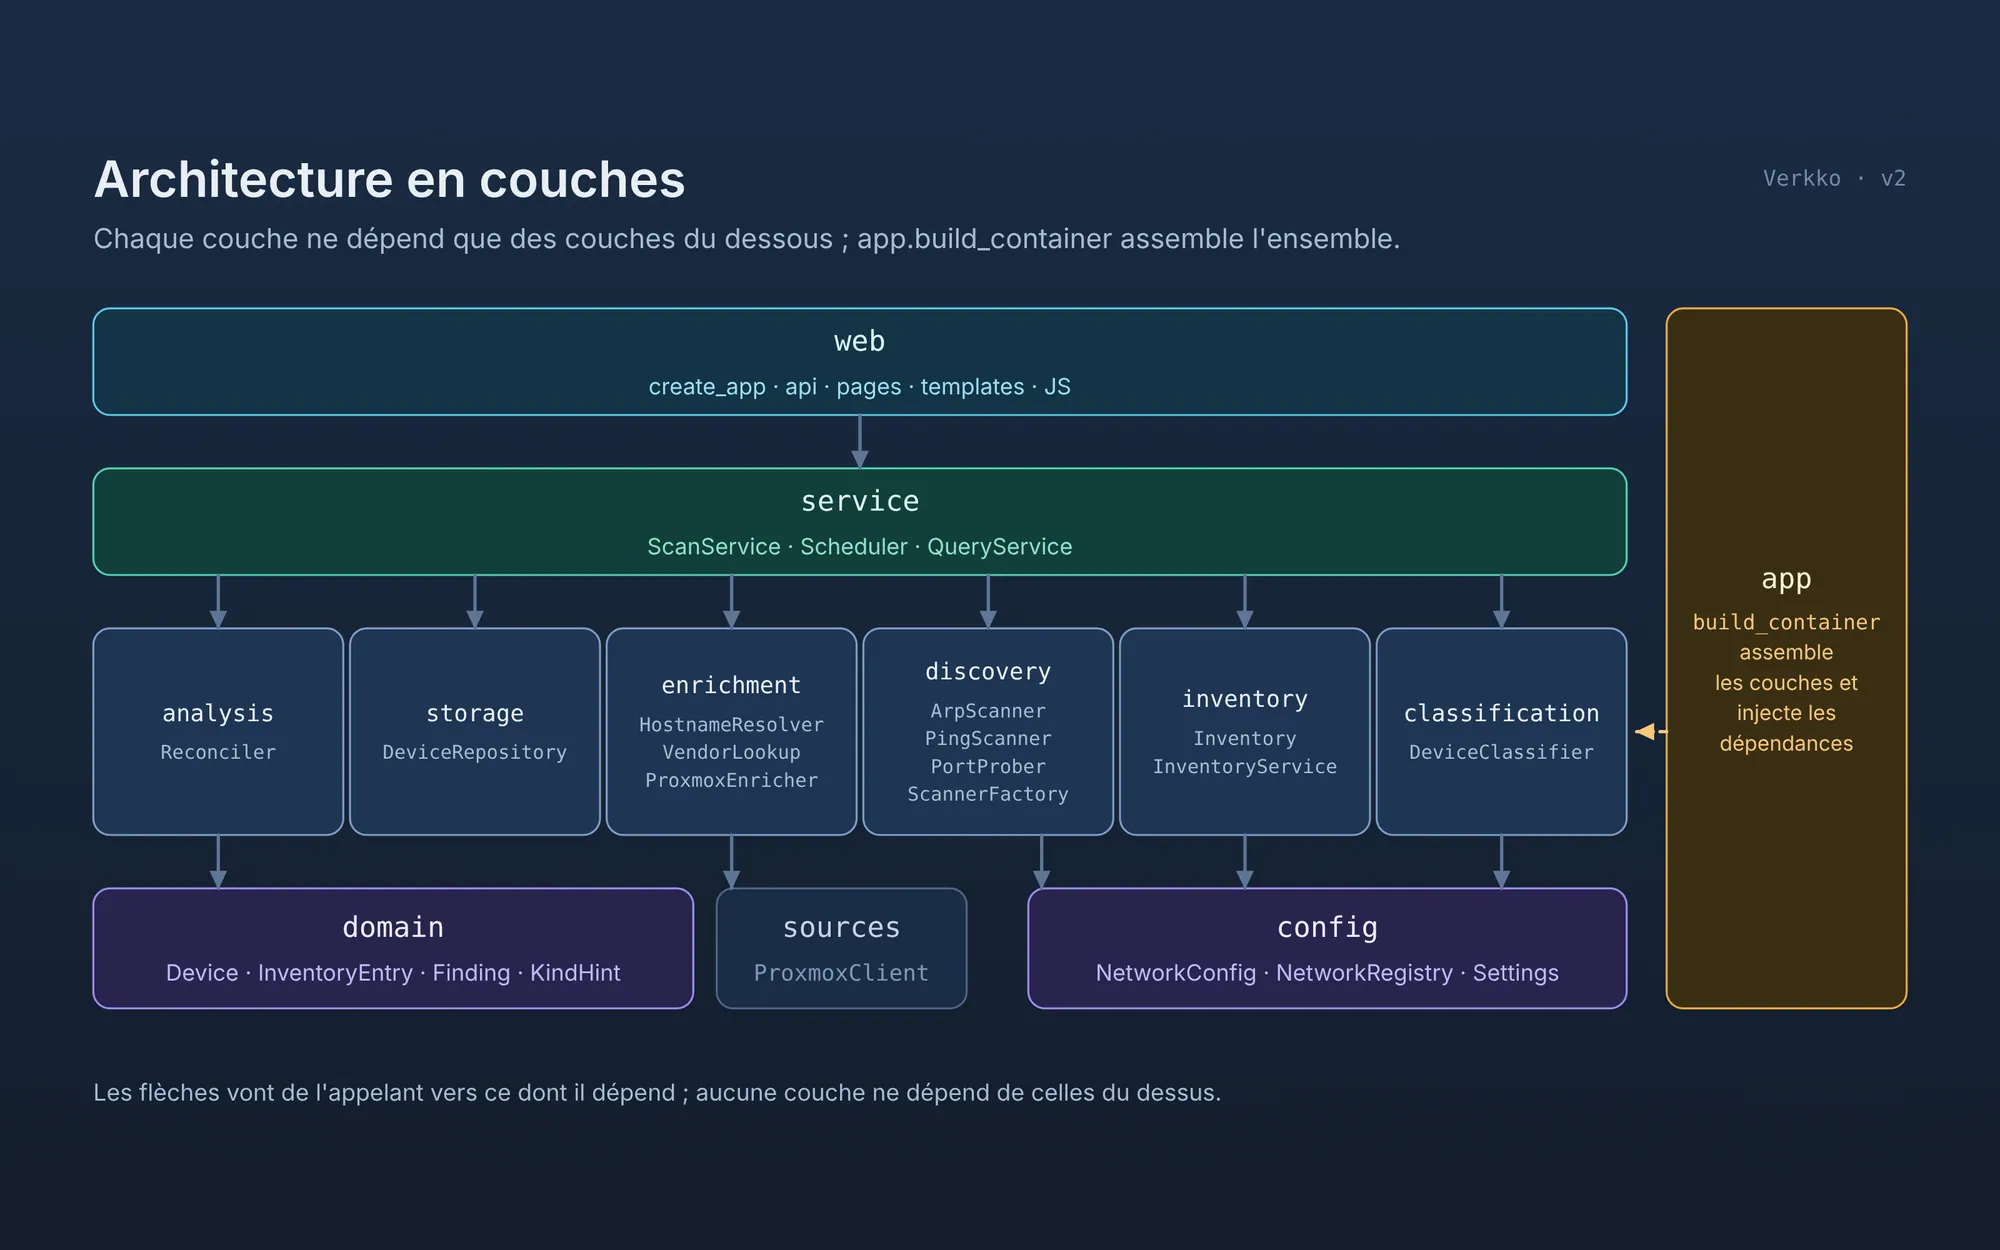
The layers of the code and the direction of the dependencies
Click an image to open it full screen and browse through the screenshots.
04 · Takeaways
What I took away from it
I learned how to structure a real project in object-oriented style: layers that only depend on the ones below them, interchangeable strategies for discovery and enrichment, and a composition root that assembles everything and lets me swap any object in the tests and the demo mode. I also learned to document with Sphinx: pages in Markdown, decision records explaining the choices, a glossary, and diagrams generated by code rather than drawn by hand. With version 2, I learned how to evolve a project that is already running: revisiting my own choices, such as replacing the YAML inventory with a database, and recording it in a new decision record rather than erasing the old one.